Valorisations and market signals
Valuation: a poor market timing indicator
Valuations are important for future performance but have little predictive power in the short term. An asset class that is expensive or cheap may remain so for a long time. For TAA, it is advisable to combine them with other factors.
Implicit risk premiums comparison
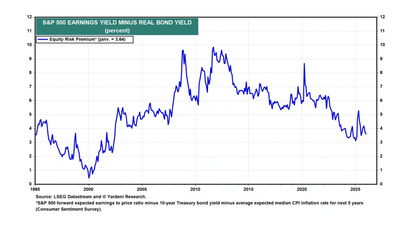
TAA relies heavily on comparing implied risk premiums between asset classes. For example, the Fed Model compares the valuation of equities with that of government bonds to determine which asset class offers the best risk/return ratio at a given point in time. The model compares two yields:
- The earnings yield of equities (the inverse of the P/E ratio, or E/P),
- The yield on 10-year government bonds (or preferably the real yields f.e. 10-year nominal yield minus the 5 year expected inflation)
When the earnings yield is higher than the bond yield, equities are considered undervalued relative to bonds, and vice versa. The difference between these two figures is sometimes referred to as the equity risk premium (ERP) in its simplified form.
The model has worked well in an environment of moderate to falling interest rates, but can be misleading in extreme situations. In a context of very low interest rates such as that of the 2010s, the model suggested that equities were permanently attractive, which may have masked high absolute valuation levels. Conversely, when rates rose sharply in 2022, the model reversed very quickly. The quality and momentum of earnings must also be taken into account.
For bonds, the duration-adjusted carry and the inflation breakeven allow different maturities and geographies to be compared.
For commodities, the structure of the forward curve (contango vs. backwardation) provides information on carry premiums and pressure on physical inventories.
Momentum and mean reversion
Inter-market momentum operates over horizons of 3 to 12 months, while reversion to the mean in valuations can be observed over horizons of 3 to 10 years (see section on smart benchmarks).